


“Hospitalization and death. That is the talking point the defenders of the Covid-19 injection harp on after conceding that the shots don’t prevent transmission. And it’s also the hill they’re willing to die on to keep the vaccine program alive. But what if we can PROVE that the shots don’t do as they claim with data? Because if they don’t prevent C19 deaths, what is the point?
So, let’s state our hypothesis: the shots don’t/no longer work against hospitalization and death and are now having a negative effect. And people in traditionally less healthy, less C19-vaccinated states (more comorbidities) will start to suffer fewer Covid-19 deaths than in historically healthier, more C19-vaccinated states (fewer comorbidities).
Surprisingly, The Washington Post gave us a head start.
Fifty-eight percent of coronavirus deaths in August were people who were vaccinated or boosted, according to an analysis conducted for The Health 202 by Cynthia Cox, vice president at the Kaiser Family Foundation.
It’s a continuation of a troubling trend that has emerged over the past year. As vaccination rates have increased and new variants appeared, the share of deaths of people who were vaccinated has been steadily rising.
Next, let’s take a look at life expectancy.
This is a map of the CDC’s data from 2019, showing average life expectancies at birth. Notice that many of the rural states, especially those located south of Iowa through Ohio, have lower life expectancies compared to the northeast.

And, to no surprise, many of these states make it to our top ten least vaccinated U.S. states (as of 8/31/22).
Top Ten Least Vaccinated States

The chart on the website listed above is broken down to the percentage of people who took one dose, two doses, and three or more doses. The fourth column, which I’ve added, is life expectancy per CDC data.
One-Dose | Two Doses | Three+ Doses | Life Expectancy
Wyoming - 59.2%, 51.9%, 23.5%, 77.7 years
Alabama - 63.9%, 52.2%, 19.7%, 75.2 years
Mississippi - 60.9%, 53%, 21.1%, 74.4 years
Louisiana - 62%, 54.4%, 22.7%, 75.7 years
Idaho - 62.4%, 55.1%, 25.3%, 79.5 years
Tennessee - 63.4%, 55.4%, 25.7%, 75.6 years
Arkansas - 68.2%, 55.6%, 23.4%, 75.7 years
Georgia - 66.9%, 56%, 22.9%, 77.4 years
North Dakota - 67.1%, 56.7%, 25.8%, 78.8 years
Indiana - 63.2%, 56.8%, 27.7%, 77.0 years
Average Two-Dose Rate - 54.71%
Average Three-Dose Rate - 23.78%
Average Life Expectancy at Birth - 76.7 years
Top Ten Most Vaccinated States
Again, we’ll track the same data. Many of these states are located in the northeast, as previously predicted. And for the record, we are excluding the District of Columbia.

One-Dose | Two Doses | Three+ Doses | Life Expectancy
Rhode Island - 95%*, 84.9%, 47.6%, 79.5 years
Vermont - 95%*, 82.8%, 52.4%, 79.8 years
Maine - 93.2%, 81.2%, 47.5%, 78.3 years
Massachusetts - 95%*, 80.8%, 43.3%, 80.4 years
Connecticut - 95%*, 80.8%, 43.3%, 80.3 years
Hawaii - 89.5%, 79.7%, 45.7%, 80.9 years
New York - 92%, 78.5%, 37.1%, 80.7 years
Maryland - 88.9%, 77.3%, 42.1%, 78.5 years
New Jersey - 92.4%, 77.1%, 38.5%, 80.1 years
Virginia - 87.9%, 74.6%, 38.1%, 79.1 years
Average Two-Dose Rate - 79.77%
Average Three-Dose Rate - 43.56%
Average Life Expectancy - 79.76 years
The Side-By-Side Numbers

Top Ten Least Vaccinated States
Average Two-Dose Rate - 54.71%
Average Three-Dose Rate - 23.78%
Average Life Expectancy at Birth - 76.7 years
Top Ten Most Vaccinated States
Average Two-Dose Rate - 79.77%
Average Three-Dose Rate - 43.56%
Average Life Expectancy - 79.76 years
The Difference
Two-Dose Rate - (79.77 - 54.71) = 25.06%
Three-Dose Rate - (43.56 - 23.78) = 19.78%
Life Expectancy - ( 79.76 - 76.7) = 3.06 years
So, people in the top ten most vaccinated states took about 25% more two-dose series and 20% more third doses than the top ten least vaccinated states. They have also historically lived about three years longer, so overall, we can assume they live healthier lifestyles with fewer comorbidities that would put them at risk of death due to Covid-19.
Now, Look at the C19 Deaths
And this is where our friends at The Highwire help. They used slightly more updated data from The New York Times, and this is what they found. The numbers are quite damning.
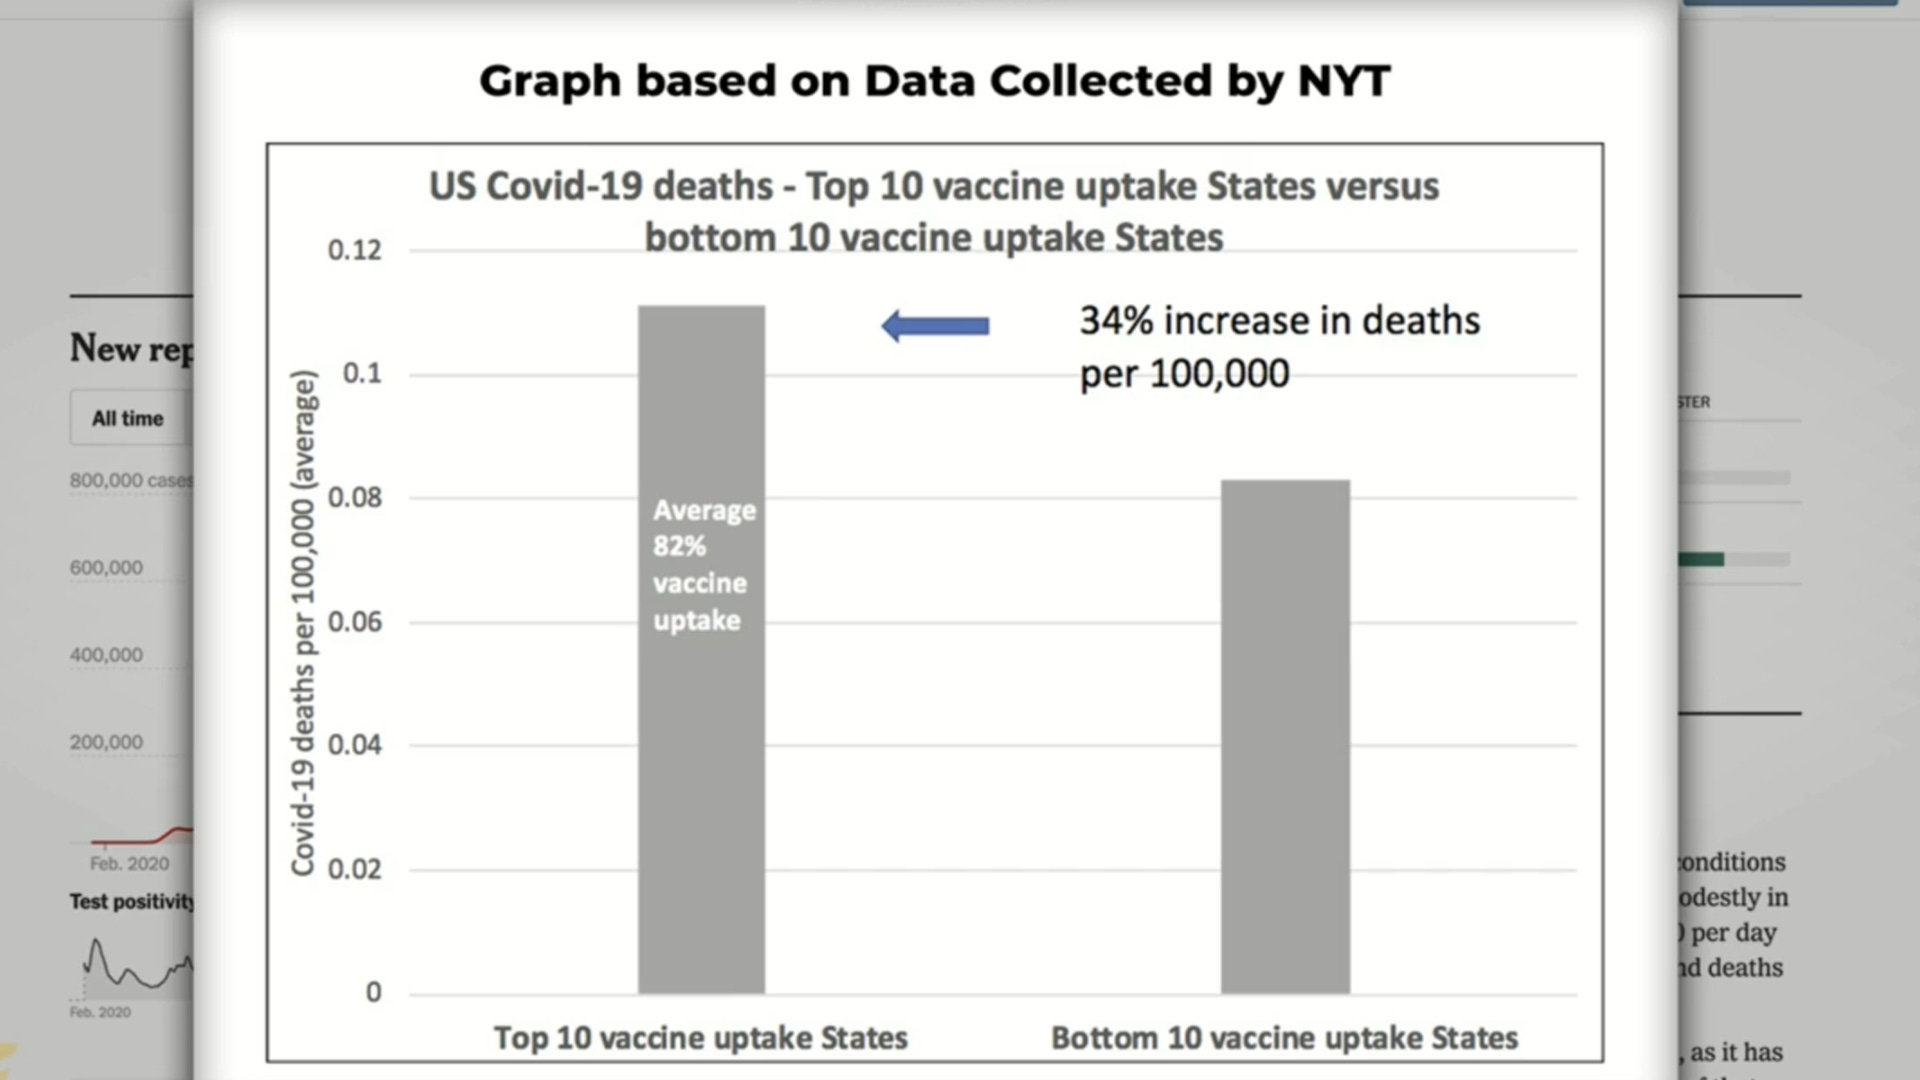
We looked at the top ten most vaccinated states; they had an average uptake of 82%. And we looked at the bottom ten least vaccinated states, and [it] turns out there’s a 34% increase in deaths per 100,000 of COVID deaths in the top ten most vaccinated states.
Jeffrey Jaxen comments, “So there's a data point that is actually really shocking, really should be alarming to a lot of people, really should be investigated.”
Agreed, Jeffrey. If the shots really were “safe and effective,” how is it possible that the top ten most vaccinated states are now seeing 34% MORE Covid-19 deaths than the top ten least vaccinated states? And why is it that programs like The Highwire and internet warriors that have to do CDC’s job for them? These things clearly aren’t working. There’s a negative efficacy signal, and nothing comes to chance when you compare ten states of data to another ten states. That’s essentially a mega meta-analysis.
But luckily, the fear is gone, and no one wants these things anymore. It’s time they accept defeat, admit wrong, and pull the Covid-19 shots off the market. They see what we see. So the longer this goes on, the more we can say it’s criminal.
If you appreciate my work and want to help keep this operation afloat, please share and/or hit the subscribe button. Also, consider checking out my exclusive articles.


Defense for Jabs Gone: Pandemic of the Vaccinated, Increased Likelihood of C19 Death